
Isotype pictograms
Fictional book-loan comparison
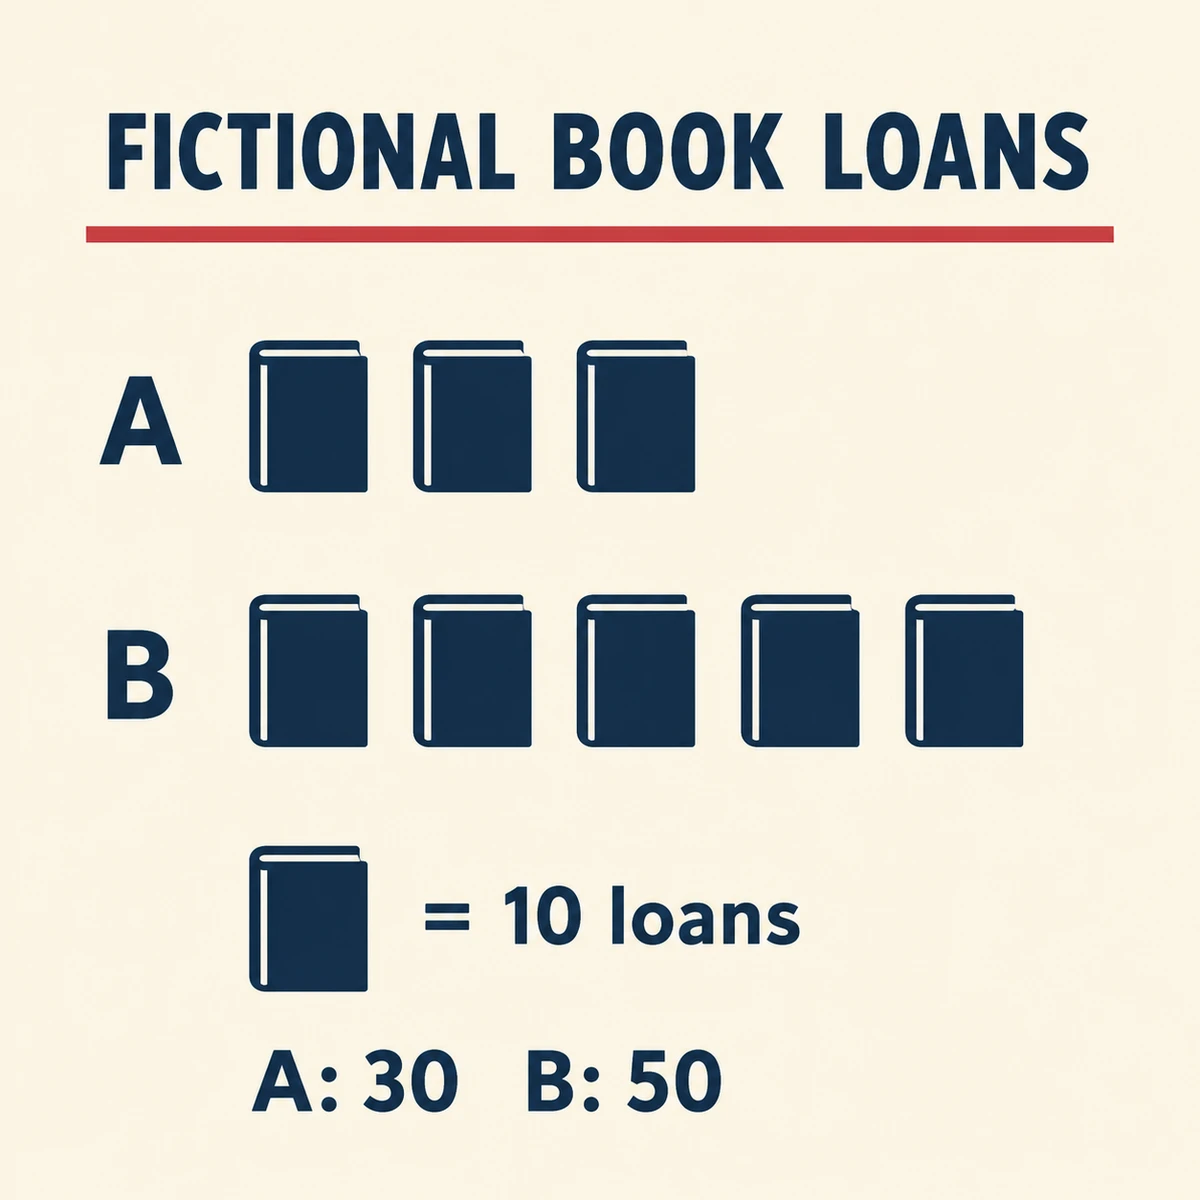
Three and five equal-sized book symbols compare invented totals of 30 and 50 loans, with a visible key of one book per ten loans.
Make
Isotype pictograms with consistent simplified symbols, repeated units for quantity, and clear modular comparison; a clean fictional data poster with disciplined spacing, symbolic repetition, and straightforward visual hierarchy.
A legible two-row comparison with a unit key replaces the unkeyed symbol sheet. Repeated same-sized pictograms encode quantity, rather than becoming decorative motifs.
A starting point: add your own subject or details in your image tool.
An original generated interpretation with a different composition.
Counts and arithmetic checked by the assistant for this image: 3×10=30 and 5×10=50. The data are invented and do not describe a real institution.
About this aesthetic and its examples
Compare more directions
Explore other approaches for this kind of project.

Look closer: traits and nearby styles →
About this example
This image may have used extra directions. The seed above is a reusable starting point and may produce a different result.
- Created with
- Built-in image generation (image_gen__imagegen)
- Model
- Not exposed by tool
- Generated
- 2026-10-26
Original AI-generated variant. Visually counted exactly three data symbols in A, five in B and one in the key. Every data symbol is the same size. The key reads = 10 loans and displayed totals A: 30 B: 50 agree with 3×10 and 5×10. Title explicitly FICTIONAL BOOK LOANS; no asserted real-world data source. Labels and key legible; no watermark or signature. Exact model and cost not exposed. Requested 2048px, received 1254×1254px; reduced to 1200px and 640px WebP. Public seed plus recorded sample art direction; no claim that the seed alone reproduces this image. No human specialist review.
How to use this promptRead as Markdown
Picture symbols and quantities
Isotype uses simplified pictograms consistently as repeatable units. For a quantitative comparison, a greater amount is represented by more symbols of the same size, rather than by enlarging a symbol.
The original symbol sheet has no unit key and does not establish verified statistics about people, homes, energy or any other subject. The book-loan variation demonstrates a keyed comparison: three and five equal-sized book symbols represent invented totals of 30 and 50 loans, at ten loans per symbol.
To make an actual information graphic, supply the data and a clear unit key, then check every count, label and comparison. An image generator’s output is not evidence that the underlying quantities are correct.
Learn more: University of Reading: Isotype Revisited
Look closer at Isotype pictograms
A fictional symbol study inspired by Isotype’s consistent pictograms, repeated units and modular spacing. This example has no unit key and does not communicate verified statistics.
In the original generated example: A fictional data poster built from repeated simplified symbols and modular counts. Notice which details catch your eye before deciding whether the whole style is for you.
Explore across projects: Letters with personality
Ask yourself: is it the palette, the surface, the shapes, or the subject you like? Save a favorite and use the visual taste guide to find a useful next direction.